
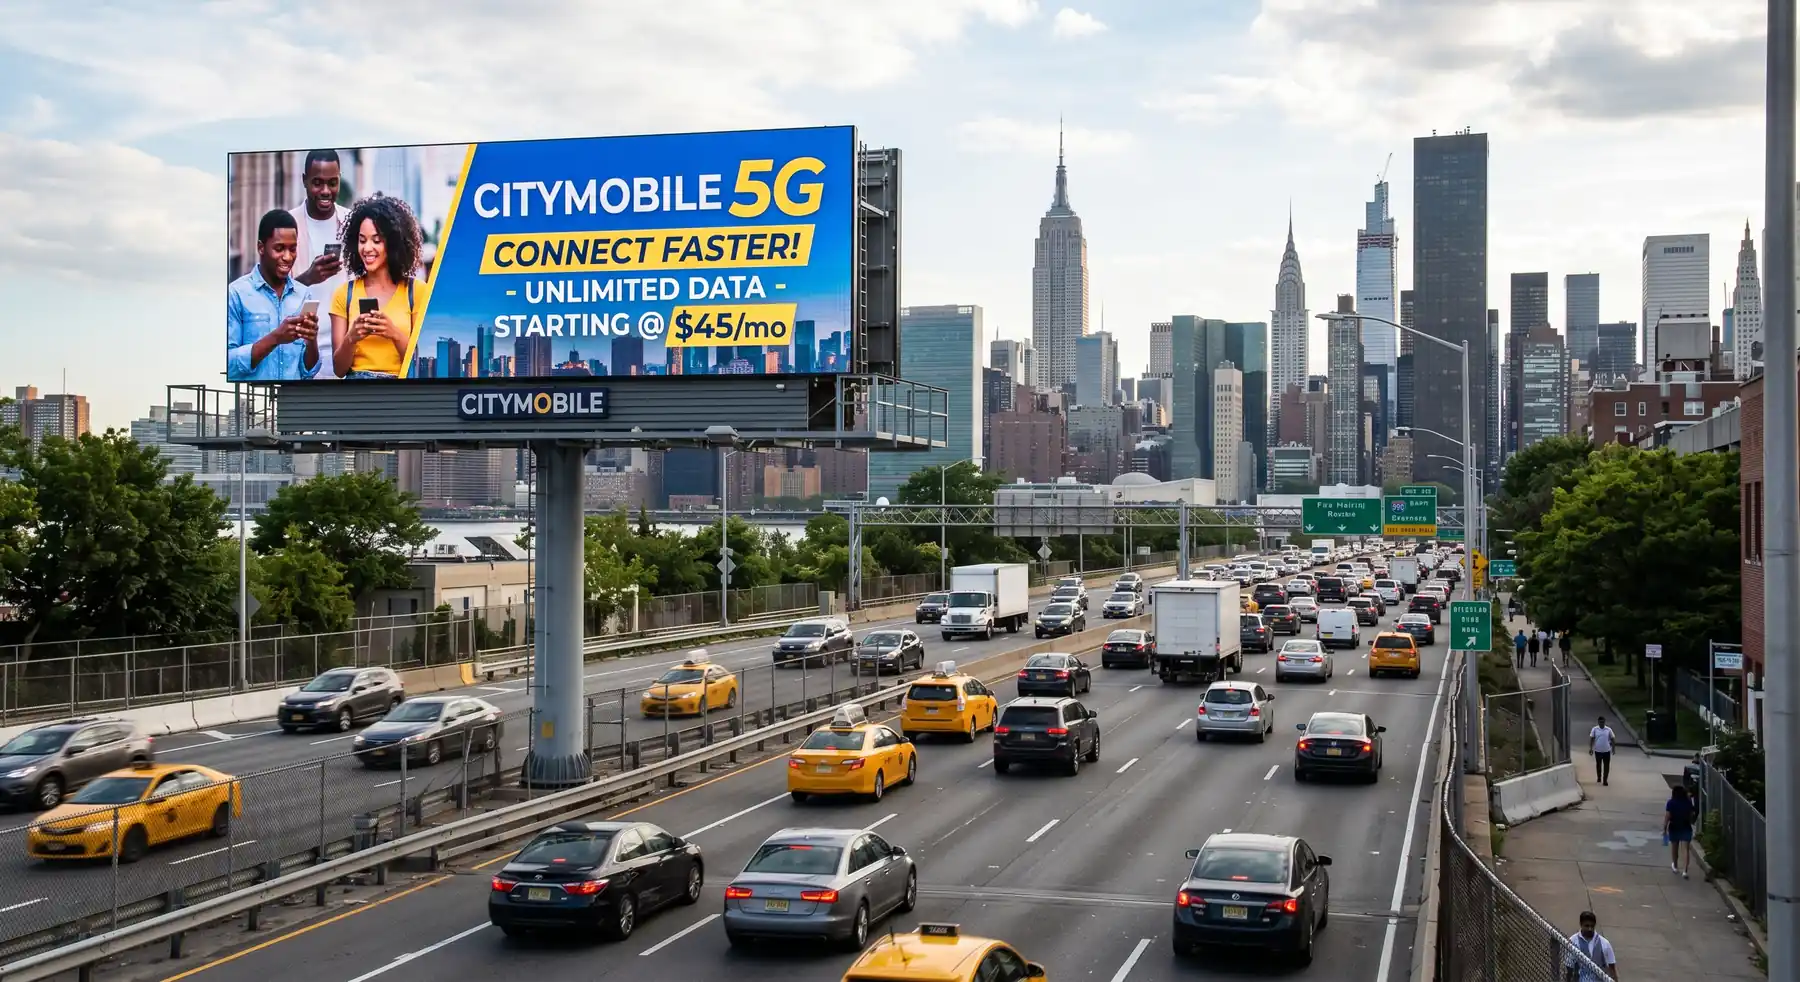
Digital out-of-home advertising is no longer a secondary media channel. According to the Out of Home Advertising Association of America, U.S. out-of-home advertising revenue reached a record USD 9.46 billion in 2025, while DOOH accounted for 36.3% of total OOH revenue.
That growth is attractive, but it can also mislead buyers. A high-traffic location and a bright LED screen do not automatically create a profitable media asset. The return depends on how revenue, uptime, electricity, maintenance, content scheduling, pixel pitch, brightness, service access, and audience measurement work together.
This guide explains how to calculate ROI before buying an outdoor LED screen. It is written from the perspective of a professional LED display manufacturer, so the focus is not only media revenue. It also shows how hardware choices can protect or damage long-term payback.
Why Screen Price Is Not the Same as ROI
Many buyers start with one question: "How much is the LED display per square meter?"
That question matters, but it is not enough. For a DOOH LED display, the purchase price is only one part of the business model. A low-cost screen can become expensive if it is too dim at noon, difficult to maintain, unstable in hot weather, or visually inconsistent after one year of operation.
For outdoor DOOH projects, ROI is created in two places:
- The media model: impressions, ad slots, occupancy rate, CPM, sponsorship, programmatic revenue, retail uplift, and campaign measurement.
- The engineering model: brightness, pixel pitch, uptime, heat dissipation, energy efficiency, weather resistance, service speed, and lifespan.
If either side is weak, payback becomes slower. If both are designed together, an outdoor LED display becomes a revenue asset instead of a large digital expense.
Start With the Basic ROI Formula
Use a simple ROI model first:
Annual ROI (%) = (Annual Net Profit / Total Project Investment) x 100Where:
Annual Net Profit = Annual Revenue - Annual Operating CostAnd:
Payback Period = Total Project Investment / Annual Net ProfitThis basic structure can be adapted for different buyers. A media company may use ad revenue. A retail brand may use incremental gross profit and avoided printing cost. A stadium may include sponsorship income and event-day sales uplift. A government or public institution may replace direct revenue with public communication value, avoided temporary signage cost, or shared-use sponsorship income.
The common mistake is calculating revenue aggressively and cost casually. Outdoor LED screens operate in sunlight, rain, heat, dust, wind, vibration, and long daily schedules. The ROI worksheet must include the cost of staying visible, stable, and available.
Audience-Specific ROI Frameworks
The ROI model changes depending on who owns the screen and why it is being installed.
| Buyer Type | Main ROI Driver | Hardware Priority |
|---|---|---|
| Advertising media companies | Ad sales, CPM, occupancy, programmatic fill, proof of play | Uptime, brightness, color consistency, remote monitoring |
| Retail brands | Foot traffic, campaign speed, product promotion, avoided printing cost | Storefront visibility, close-viewing image quality, easy content updates |
| Event and rental companies | Rental utilization, sponsor visibility, repeat deployment | Impact resistance, fast installation, lightweight cabinets, GOB protection |
| Stadiums and venues | Sponsorship packages, fan engagement, F&B promotion | High refresh rate, weather resistance, broadcast-friendly performance |
| Hotels and tourism sites | Guest experience, wayfinding, brand image, on-site promotion | Aesthetic integration, resolution, quiet operation, reliable scheduling |
| Government and public institutions | Public information, safety messaging, lower manual update cost | Long lifespan, low maintenance, stable operation, access control |
| Education and corporate campuses | Communication efficiency, emergency alerts, recruitment and events | CMS integration, scheduled messaging, dependable operation |
For measurement language, it is useful to align internal teams with industry terminology. The IAB DOOH Glossary and Geopath Glossary are helpful references for terms such as impressions, reach, frequency, audience, and proof of play.
CapEx: What Should Be Included Before Installation?
The LED display cabinet is only one line in the investment. A serious CapEx model includes the complete installed system.
Typical capital costs include:
- LED modules and cabinets
- Steel structure, mounting frame, or monopole
- Control system, receiving cards, video processor, media player, and sensors
- Power distribution, grounding, electrical routing, and cabling
- Installation labor, crane rental, lifting equipment, and commissioning
- Permits, zoning review, structural engineering, and local compliance
- Shipping, duties, insurance, packaging, and customs clearance
- Spare modules, spare power supplies, and maintenance tools
- CMS setup, software licensing, and network configuration
Outdoor LED billboard cost varies widely because the use case varies. A highway billboard, a retail facade, a stadium ribbon board, and a public information screen may all be "outdoor LED displays," but they need different structures, brightness levels, pixel pitches, cabinet designs, and service plans.
Outdoor LED Display Price Ranges by Use Case
Pixel pitch is one of the biggest drivers of LED display price. A smaller pitch uses more LEDs per square meter, increases manufacturing complexity, and raises the cost.
| Display Category | Pixel Pitch | Optimal Viewing Distance | 2026 Hardware Price Range | Primary Applications |
|---|---|---|---|---|
| Large-format billboard | P8-P10 | 25-100+ m | USD 350-950/m2 | Highways, stadium exterior screens |
| Standard commercial outdoor | P5-P6 | 10-25 m | USD 500-1,300/m2 | Plazas, gas stations, commercial signs |
| High-resolution outdoor | P3.9-P5 | 5-15 m | USD 800-1,800/m2 | Street retail, transit, pedestrian zones |
| Ultra-premium GOB outdoor | P1.2-P4 | 2-10 m | USD 1,000-7,000/m2 | Premium facades, rental, close-viewing displays |
Choosing too small a pixel pitch wastes capital when the audience views the screen from far away. Choosing too large a pixel pitch damages creative quality when people view the display at close range.
SMD, GOB, and COB: Packaging Choices That Affect ROI
The LED packaging technology changes both upfront cost and long-term risk.
SMD (Surface-Mounted Device) is the standard choice for many outdoor LED displays. It offers good image quality and cost efficiency, but the individual diodes are more exposed to impact than protected technologies.
GOB (Glue-On-Board) adds a transparent protective layer over the LED surface. It improves resistance to impact, dust, moisture, and handling damage. For rental, event, retail facade, and high-traffic installations, the higher initial price can be justified by lower repair frequency.
COB (Chip-On-Board) bonds LED chips directly to the PCB. It can deliver strong contrast and heat performance, but for many outdoor DOOH projects the cost is still too high compared with SMD or GOB.
The best choice depends on the business model. A rental screen that breaks after every event has poor ROI even if the purchase price looked attractive. A roadside billboard that is rarely touched may not need the same level of impact protection.
TCO: The 60-Month Reality
Total Cost of Ownership is often more important than the purchase price. A screen that costs 30% less on day one can cost much more over five years if it consumes more electricity, fails more often, or requires frequent calibration.
| 5-Year Expense Category | Budget / Low-Quality Display | Premium / High-Efficiency Display |
|---|---|---|
| Initial purchase price | USD 30,000 | USD 60,000 |
| Electricity cost | USD 20,440 | USD 8,945 |
| Module replacements | USD 8,000-15,000 | USD 500-1,500 |
| Recalibration services | USD 3,000-12,000 | USD 1,500-4,000 |
| Technician callouts | USD 3,000-12,000 | USD 300-800 |
| Total 5-year expenditure | USD 64,440-89,440 | USD 71,245-75,245 |
The cheaper screen may still look less expensive in some scenarios. But once downtime, lost advertising revenue, make-goods, emergency labor, and brand damage are included, the premium screen often becomes the safer commercial choice.
Energy Cost: Convert the Formula Images Into Text
Electricity is one of the largest recurring costs for outdoor LED displays. High-brightness screens must remain readable in direct sunlight, and poor power design can quietly reduce profit every day.
The first formula is daily energy consumption:
Daily Energy (kWh) = [Average Power (kW/m2) x Screen Area (m2)] x Operating HoursThe second formula is monthly electricity cost:
Monthly Cost = Daily Energy (kWh) x 30 Days x Electricity Rate ($/kWh)For electrical planning, maximum power matters. For ROI planning, average power is usually more useful. Maximum power describes the theoretical load when the screen runs at full brightness with a full white image. Real DOOH content includes color, dark areas, text, and video, so average power is commonly much lower than peak power.
ENERGY STAR signage display criteria note that certified signage displays meet energy efficiency requirements in active and low-power modes. For DOOH LED screens, buyers should still request project-specific maximum power, average power, brightness assumptions, and operating schedule data from the manufacturer.
Common Cathode Technology and Long-Term Savings
Traditional common anode LED designs often supply a uniform voltage across red, green, and blue chips. Because red LEDs require lower voltage than green and blue LEDs, the unused voltage becomes heat.
Common cathode designs route power more precisely to different LED colors. In many outdoor display projects, this can reduce power consumption and heat generation, especially in high-brightness applications.
Example:
| Item | Common Anode Display | Common Cathode Display |
|---|---|---|
| Screen size | 100 m2 | 100 m2 |
| Average power | 450 W/m2 | 200 W/m2 |
| Daily operation | 24 hours | 24 hours |
| Daily energy | 1,080 kWh | 480 kWh |
| Electricity rate | USD 0.15/kWh | USD 0.15/kWh |
| Annual cost | USD 59,130 | USD 26,280 |
In this example, the energy-saving design preserves USD 32,850 per year. Over a long lease period, the saving can be larger than the initial hardware price difference.
DOOH Revenue Modeling: Impressions and Multipliers
Online advertising often treats one ad served as one impression. DOOH is different because it is a one-to-many medium. One ad play on one screen may be seen by multiple people at the same time.
The third formula from the document becomes:
Publisher Impressions (Audience) = Served Ad Plays x Impression MultiplierBroadsign explains the DOOH impression multiplier as a metric used to calculate how many impressions a screen delivers in a single ad play. The multiplier may be based on audience data such as traffic counts, location data, sensors, dwell time, venue attendance, or camera-based analytics, depending on the network and market rules.
Example:
- A 10-second ad plays on a transit shelter LED display.
- The screen registers 8 people in the viewing zone.
- The CMS records one served ad play.
- The impression multiplier is 8.
- The publisher records 8 impressions for that ad play.
This is why hardware quality affects revenue. A screen that cannot prove uptime, display quality, scheduling accuracy, and proof of play will struggle to support premium ad pricing.
Share of Voice and Loop Optimization
DOOH inventory is usually sold inside a loop. If a screen runs a 60-second loop with six 10-second slots, each advertiser receives about 16.7% share of voice.
Selling too many slots may increase short-term revenue on paper, but it can reduce campaign performance. If a passing audience sees the screen for only 8 seconds and the advertiser's creative does not appear during that window, effective exposure drops.
A practical ROI model should include:
- Loop length
- Slot duration
- Number of paid advertisers
- Occupancy rate
- Direct sales vs. programmatic fill
- Discounts and agency commissions
- Make-good risk if uptime falls below contract requirements
Programmatic DOOH and Yield Optimization
Programmatic DOOH connects screens to buying platforms so unsold inventory can be filled dynamically. This can improve occupancy, reduce blank inventory, and allow advertisers to trigger campaigns based on time, weather, audience, location, or contextual data.
For example:
- A coffee brand runs ads only during cold mornings.
- A tourism brand increases bids near transport hubs during holiday travel.
- A retail brand runs a campaign when weather conditions favor specific products.
- A local advertiser uses geofencing to retarget people who passed the screen.
Software platforms, proof-of-play reporting, audience measurement, and attribution tools should be included in OpEx. They add cost, but they can also increase sellable value.
Example ROI Model 1: Retail Brand
For a retail brand, the screen may not sell third-party advertising. Instead, it drives foot traffic, product promotion, and faster campaign changes.
Assumptions:
| Item | Value |
|---|---|
| Baseline daily gross revenue | USD 2,000 |
| Outdoor LED display investment | USD 40,000 |
| Conservative revenue uplift | 15% |
| Daily increase | USD 300 |
| Operating days per year | 300 |
| Annual additional revenue | USD 90,000 |
The fourth formula from the document becomes:
ROI (%) = [(Additional Revenue - Display Cost) / Display Cost] x 100Applied to the example:
ROI = [($90,000 - $40,000) / $40,000] x 100
ROI = 125% first-year ROI
This result depends on real store conditions. A screen in the wrong location, with poor brightness, weak content, or bad viewing angle, will not create the same result. Treat the model as a planning framework, then validate it with local traffic, margins, and campaign data.
Example ROI Model 2: Independent Media Operator
For a highway digital billboard, the model is based on ad slots, traffic exposure, operating cost, and uptime.
Assumptions:
| Item | Value |
|---|---|
| Screen profile | 14 ft x 48 ft, approx. 62 m2 |
| Daily traffic | 50,000 vehicles |
| Average occupants per vehicle | 1.5 |
| Daily potential exposures | 75,000 |
| Monthly potential impressions | 2.25 million |
| Display hardware | USD 45,000 |
| Steel structure and foundation | USD 60,000 |
| Electrical and software setup | USD 15,000 |
| Total initial CapEx | USD 120,000 |
| Monthly OpEx | USD 3,300 |
| Ad slots sold | 8 |
| Average monthly rate per slot | USD 1,500 |
| Monthly revenue | USD 12,000 |
| Net monthly profit | USD 8,700 |
In this model:
Payback Period = $120,000 / $8,700
Payback Period = 13.8 months
The model works only if the screen stays online and advertisers keep renewing. If the display is down for weeks waiting for spare parts, the land lease and fixed costs continue while revenue disappears.
Attribution: How to Prove DOOH ROI
Modern DOOH campaigns are increasingly measured with data rather than estimated only by location quality.
Bottom-of-funnel attribution may use anonymized mobile location data to compare exposed audiences with later store visits. A geofence can be drawn around the display's viewshed and another around the advertiser's store. If exposed devices later enter the store area, the campaign can estimate visit lift.
Middle-of-funnel attribution may use branded search lift, direct website traffic from screen-area ZIP codes, QR code scans, coupon codes, or landing page visits.
Top-of-funnel measurement may use brand lift studies, mobile surveys, control groups, ad recall, purchase intent, or sentiment changes.
These tools do not replace a good screen specification. They make the specification more important, because measurement is only valuable when the display actually delivers the scheduled campaign at the required quality.
Engineering Variables That Change ROI
Brightness protects sellable impressions. Outdoor screens must remain readable in direct sunlight. Automatic brightness control helps reduce energy cost at night and prevents uncomfortable viewing.
Pixel pitch protects location value. Match pitch to viewing distance. A screen viewed from 80 meters does not need the same resolution as a pedestrian-facing retail display viewed from 8 meters.
Uptime protects advertiser confidence. Frequent blackouts create make-goods, contract risk, and lost renewals. Uptime depends on module quality, power design, control stability, thermal design, waterproofing, and monitoring.
Service access protects margin. Front-service cabinets reduce maintenance time when rear access is limited. Rear-service designs work well when a proper maintenance corridor exists.
Weather resistance protects lifespan. Outdoor LED displays need appropriate IP protection, drainage, corrosion resistance, sealed power areas, and climate-specific design for salt air, humidity, snow, dust, or extreme heat.
Refresh rate protects camera use. Stadiums, events, livestreams, and broadcast environments need high refresh rate and good grayscale performance to avoid flicker and banding on camera.
Practical ROI Worksheet
Use this worksheet before requesting a final quotation.
| Item | Example Assumption |
|---|---|
| Screen size | 60 m2 |
| Total project investment | USD 180,000 |
| Monthly ad slots sold | 8 |
| Average monthly rate per slot | USD 2,500 |
| Monthly gross revenue | USD 20,000 |
| Annual gross revenue | USD 240,000 |
| Annual power cost | USD 18,000 |
| Annual maintenance and connectivity | USD 12,000 |
| Site lease, insurance, admin | USD 30,000 |
| Annual operating cost | USD 60,000 |
| Annual net profit | USD 180,000 |
| Payback period | 1.0 year |
| Annual ROI | 100% |
Stress-test the assumptions:
- If occupancy drops from 8 slots to 5, annual gross revenue becomes USD 150,000.
- With the same operating cost, annual net profit falls to USD 90,000.
- Payback period extends from 1 year to 2 years.
- If poor brightness reduces ad rates, payback stretches again.
- If downtime causes refunds or make-goods, the loss may exceed the money saved by choosing a cheaper screen.
Red Flags in a DOOH ROI Projection
Be careful when the model depends on perfect conditions.
Red flags include:
- Revenue calculated at 100% occupancy from the first month
- No allowance for discounts, agency commission, or seasonal demand
- Power cost ignored or estimated from peak power only
- No budget for spare parts, cleaning, calibration, or emergency service
- Brightness selected without checking sun direction and viewing distance
- Pixel pitch chosen only by price
- No plan for content scheduling, proof of play, or remote monitoring
- Service access blocked by the building, pole, or facade structure
- Generic weatherproofing with no local climate review
- Supplier quotation missing power, structure, control system, or installation assumptions
An honest ROI model should survive a conservative scenario. If payback works only when every slot sells at full price and nothing ever fails, the project needs redesign.
Manufacturer Buying Checklist
Before buying an outdoor DOOH LED display, ask:
- What is the target viewing distance, and how does it justify the pixel pitch?
- What brightness is required for the installation direction and local sunlight?
- Is automatic brightness control included?
- What is the expected average power consumption, not only maximum power?
- Is the cabinet designed for front service, rear service, or both?
- What IP rating applies to the front and rear of the display?
- How is heat managed inside the cabinet?
- What spare parts are included in the first shipment?
- How are modules, power supplies, and receiving cards accessed after installation?
- What remote monitoring or fault diagnosis is available?
- What acceptance tests will be completed before shipment?
- What documentation will support local installation and maintenance?
- How should the screen be adapted for salt air, high humidity, dust, snow, or extreme heat?
Conclusion: Calculate Payback Before Choosing the Screen
The best DOOH LED display is not automatically the most expensive option. It is also rarely the cheapest. It is the system that matches the revenue model, viewing distance, climate, operating hours, content plan, service method, and measurement requirements.
Before buying an outdoor LED screen, build a 60-month ROI model. Estimate revenue conservatively. Include the full installed system cost. Calculate electricity from average power, not only peak power. Stress-test occupancy and downtime. Then choose the screen specification that protects the business case.
If you are planning an outdoor fixed LED display project, share your location, screen size, viewing distance, climate, operating hours, content plan, and revenue model with the manufacturer. A reliable supplier should help you compare CapEx, TCO, energy consumption, service access, and long-term DOOH revenue potential before you commit capital.